Maps and Infographics
Maps were my gateway into the world of design. Their elegance and rich layers of meaning allow complex concepts to be understood at a glance, seamlessly merging geography with data or detailed narratives. To craft my maps, I rely on geographic software such as QGIS, which, when combined with SQL and Python, enables precise data selection and representation. I then refine the visuals with Adobe Illustrator, adding a layer of aesthetic sophistication to the final product. A key area of expertise is georeferencing historical maps and reimagining them through a modern lens. My work has been published in both print and digital formats.

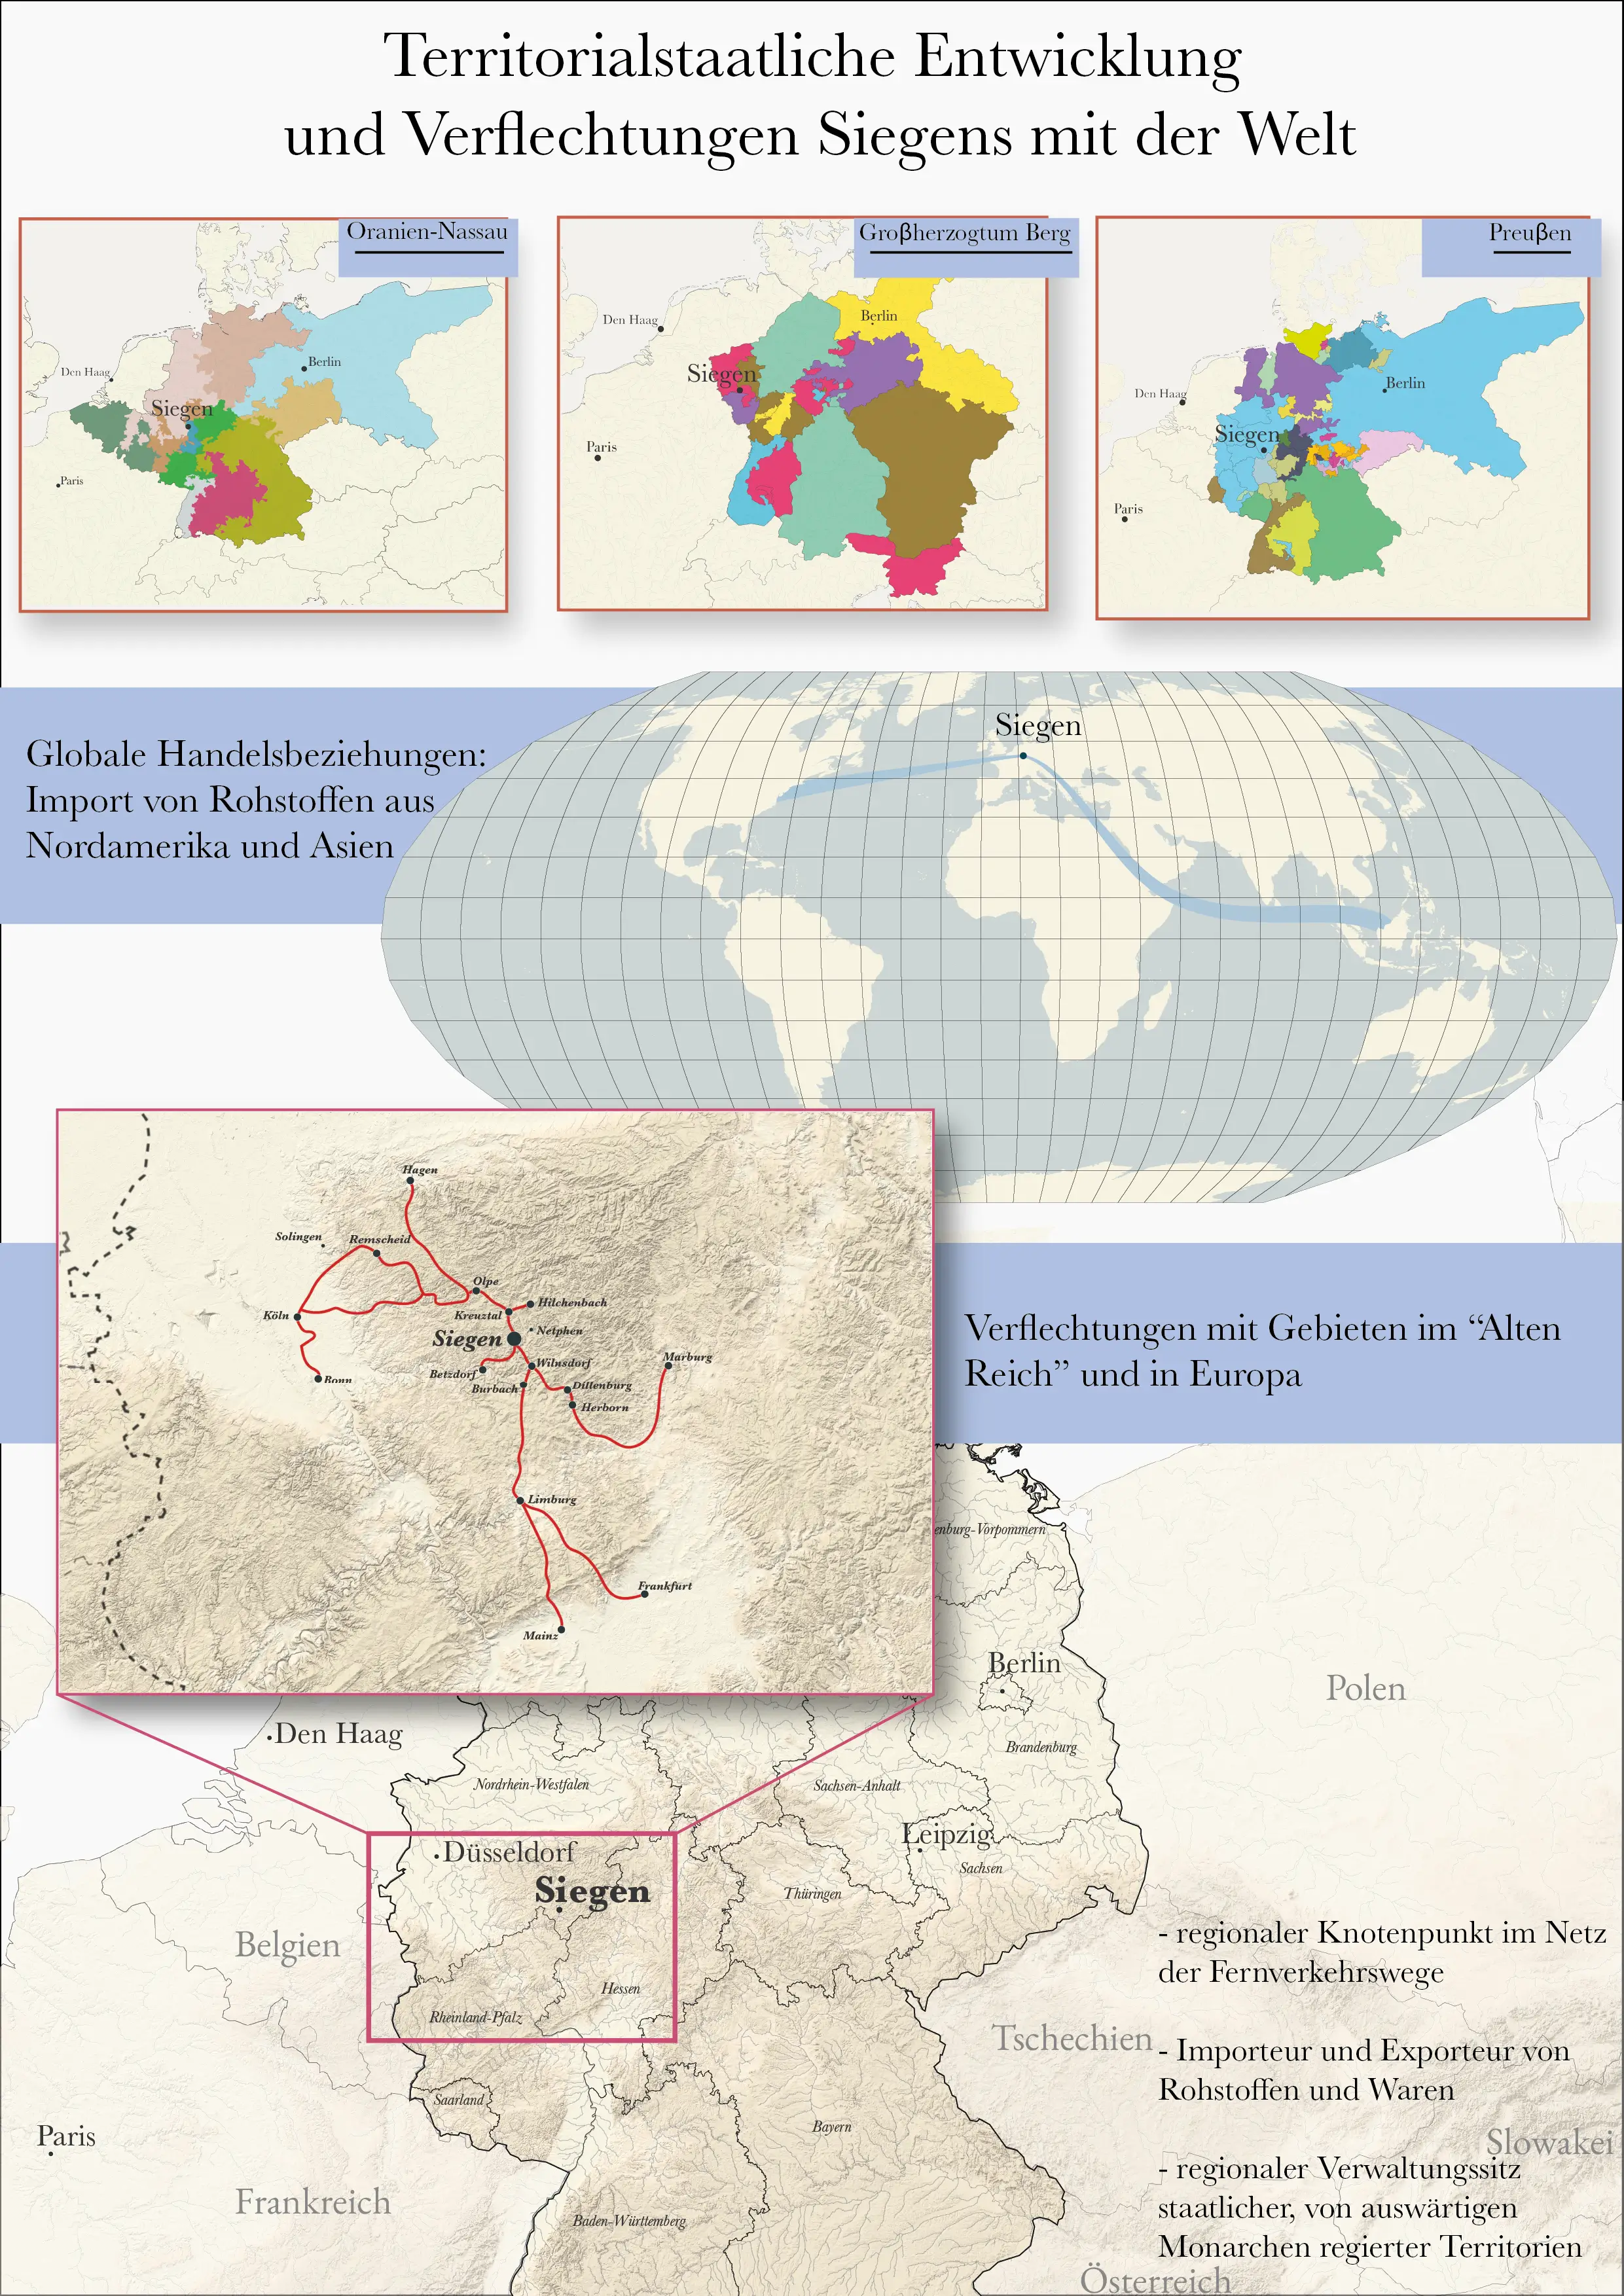
Map commissioned by the University of Siegen.

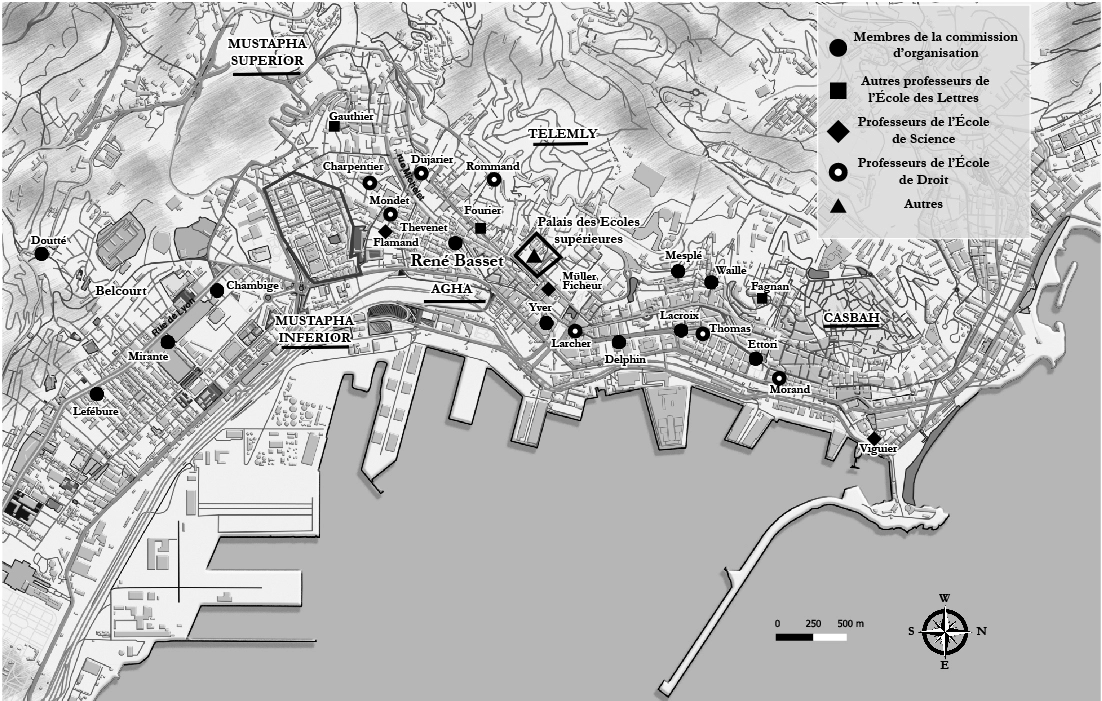
One of the maps in a book published by Éditions de l'École des hautes études en sciences sociales, L’orientalisme en train de se faire: Une enquête collective sur les études orientales dans l’Algérie coloniale. Written by Marie Bossaert, Emmanuel Szurek & Augustin Jomier.
.a032121a.webp)
One of the maps published on fanack.com, an independent multimedia platform which publishes content about Middle Eastern politics.

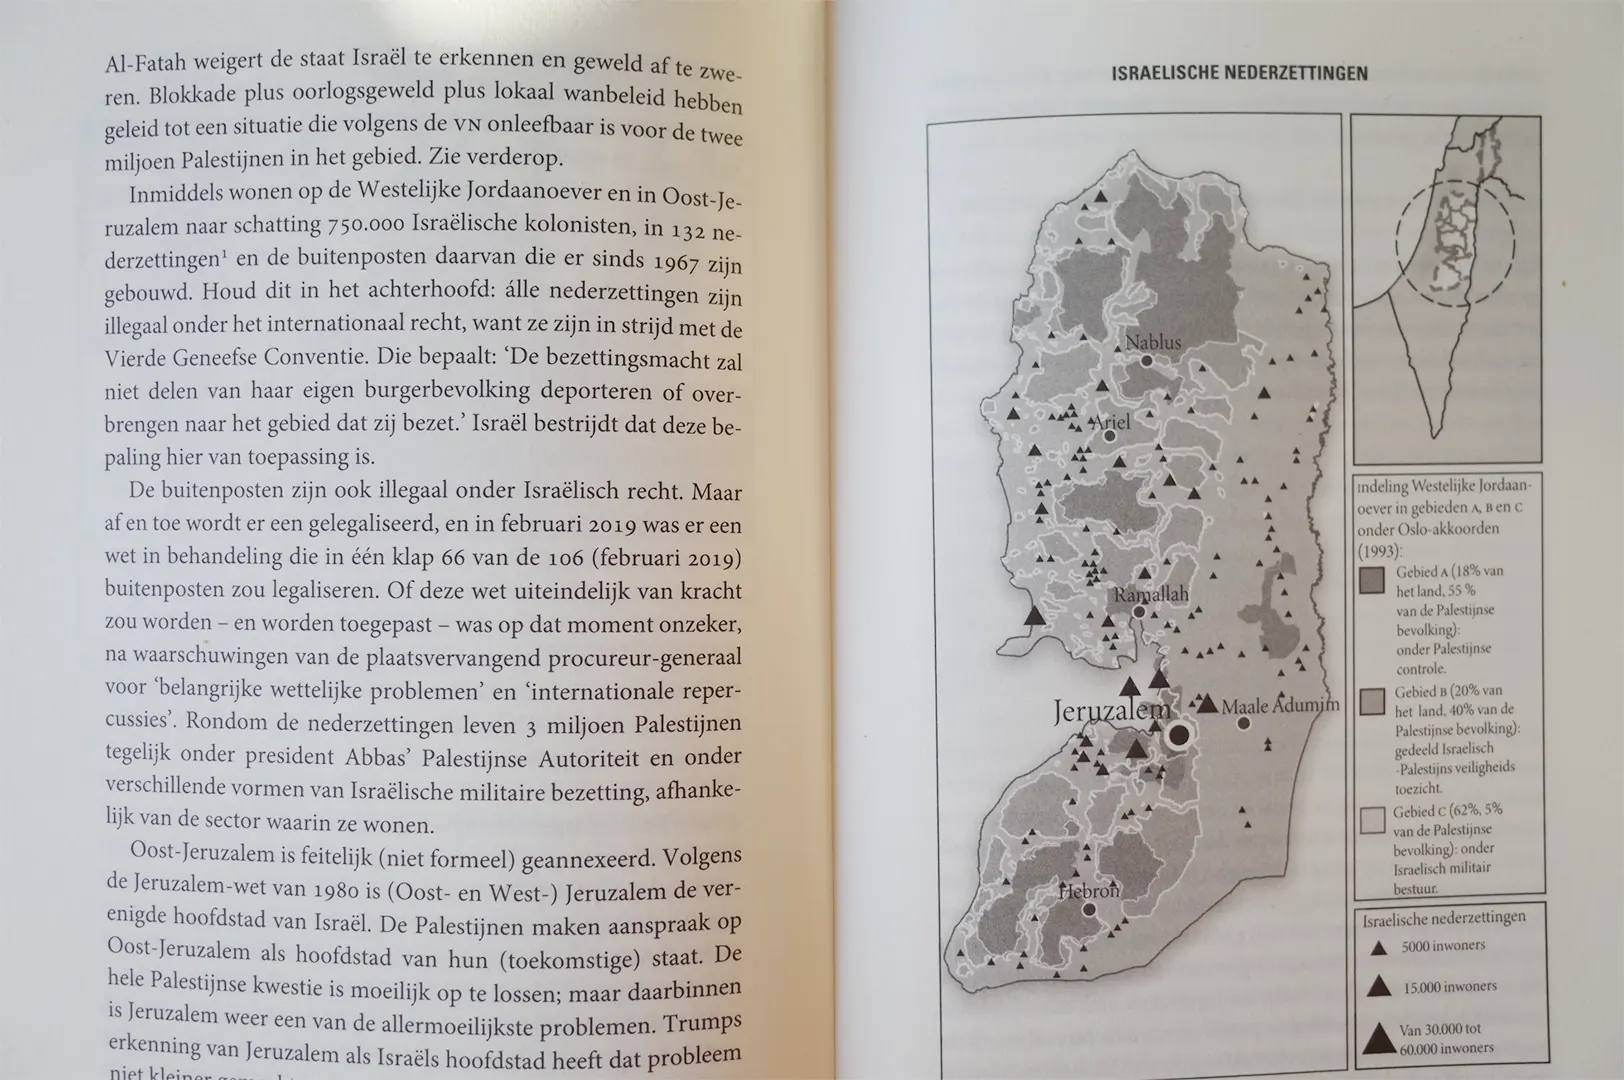
I created maps and infographics for Caroline Roelants' book Dwars door het Midden-Oosten, which were highly successful in clarifying her explanations of geopolitical issues through extremely thorough graphics. Caroline Roelants is a specialist in Middle Eastern politics and history and one of the most acclaimed journalists in the Netherlands.